Ethereum ETF Inflows Hit $2.18B in a Week as FOMO Fuels $3,800 Surge
Ethereum is on fire, climbing above $3,700 – a level not seen since early 2024 – and showing no signs of slowing down. The second-largest cryptocurrency by market cap has soared over 50% since late June, with bulls firmly in control and no significant pullbacks in sight.
This rally is fueled by growing institutional demand, recent regulatory clarity in the United States, and strong on-chain metrics, all driving renewed investor confidence. As Ethereum eyes the critical $4,000 resistance, analysts are buzzing about the potential for new multi-month highs. Here’s why Ethereum’s latest move is turning heads and what to watch next.
ETF Inflows Skyrocket, Sparking FOMO – Fear Of Missing Out
Analyst Ted Pillows recently shared data highlighting a massive $2,182,400,000 in Ethereum ETF inflows last week, signaling a surge in institutional interest. Pillows notes, “FOMO just getting started,” as traditional investors embrace Ethereum as a viable asset, thanks to clearer U.S. regulatory frameworks. These frameworks have solidified Ethereum’s position as the leading smart contract platform, making it a go-to choice in the maturing crypto ecosystem.
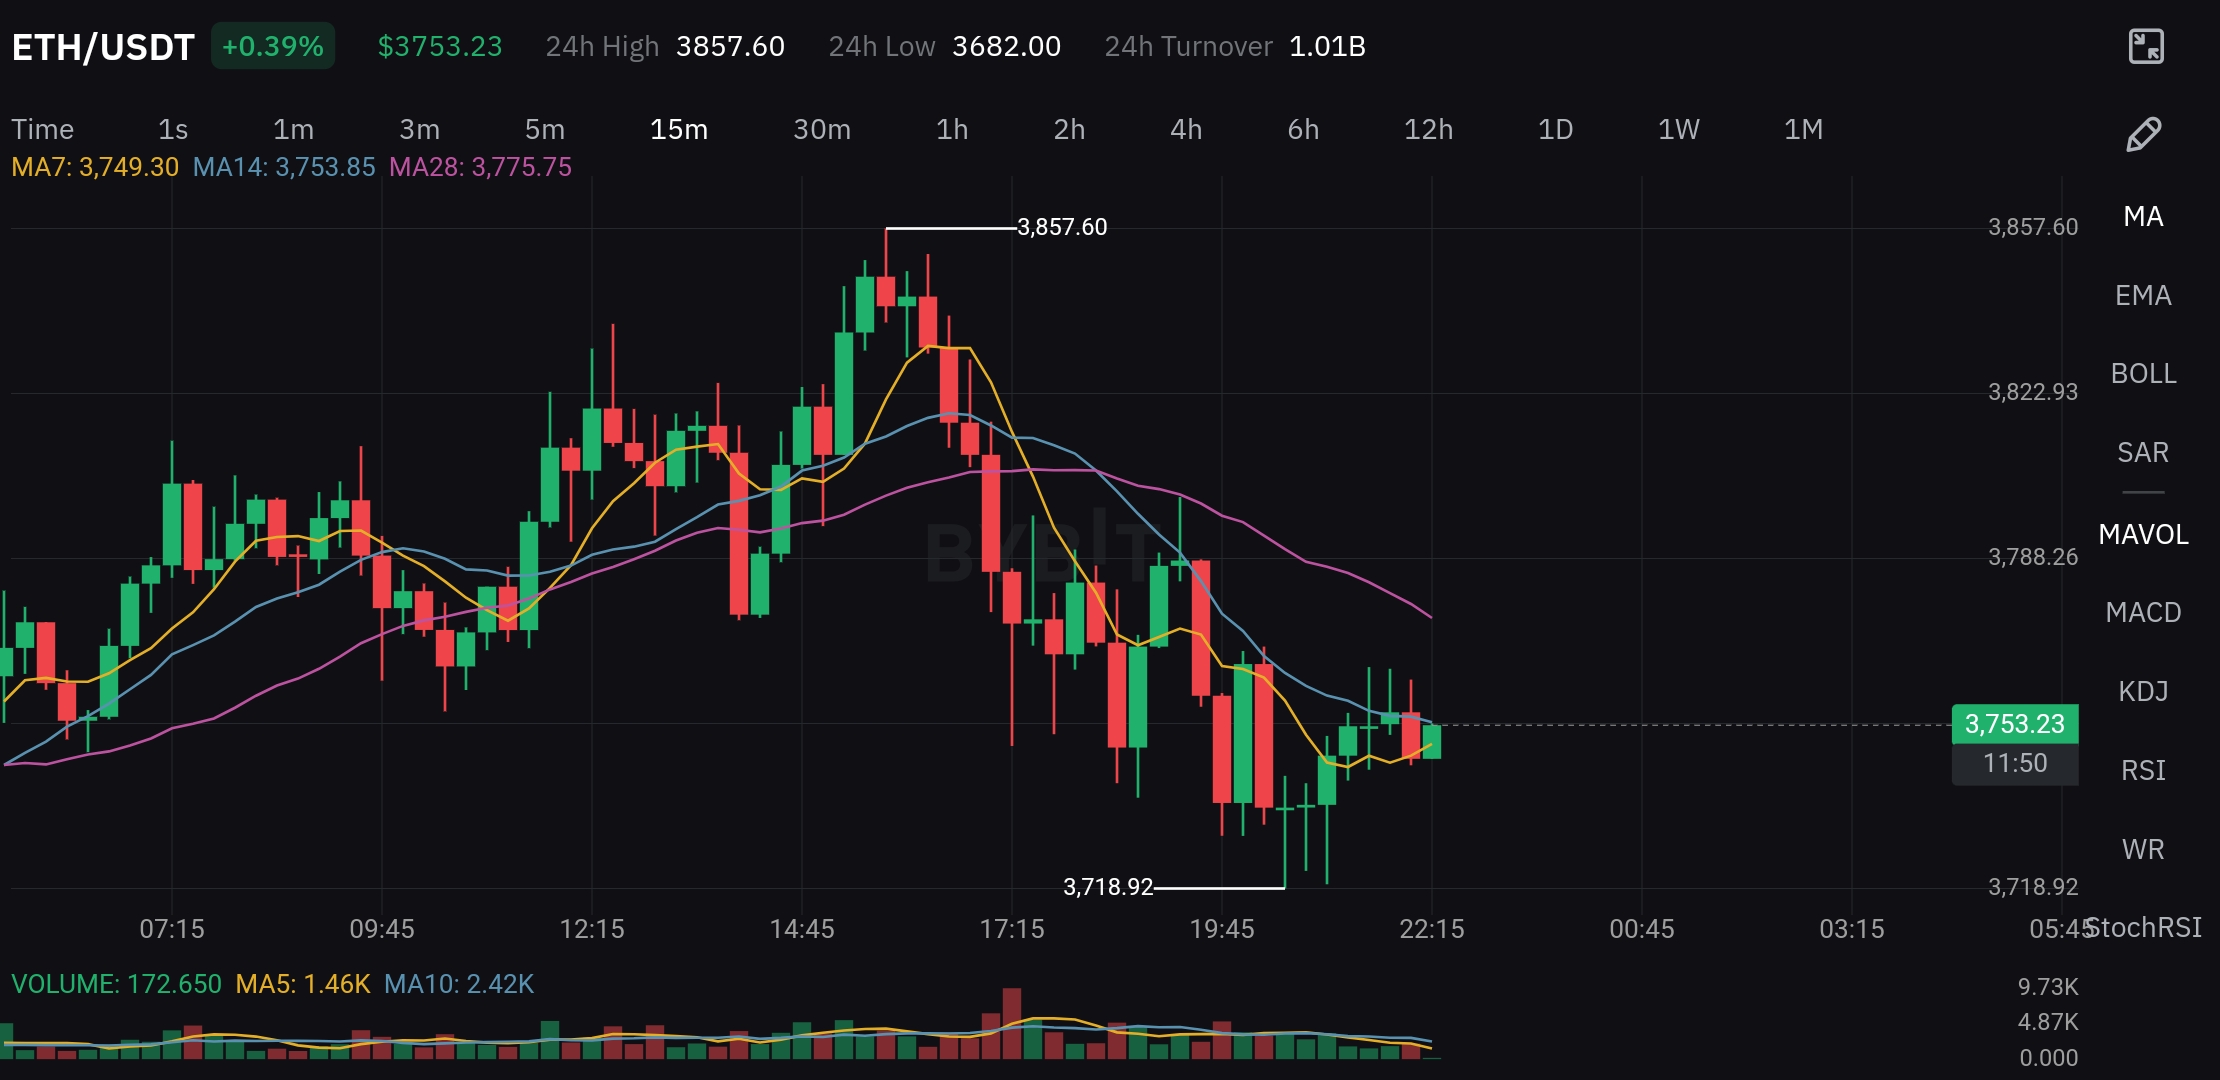
This influx of capital has propelled Ethereum to reclaim $3,800, sustaining a powerful uptrend since late June. However, some analysts urge caution. While the bullish momentum is undeniable, the lack of a healthy correction to reset momentum could lead to short-term consolidation.
As Ethereum nears the $4,000 psychological resistance – untested since December – price action in the coming weeks will be critical. A decisive break above this level could confirm the rally’s continuation, but a brief cooldown remains possible to strengthen the foundation for further gains.
Ethereum’s Weekly Chart Signals Bullish Strength

Ethereum’s weekly chart paints a picture of robust bullish momentum. Trading around $3,800, ETH has broken through the $2,852 support and cleared the $3,742 resistance zone with ease. Rising trading volume and a steep price incline underscore the strength of this move. Ethereum now sits comfortably above its 50, 100, and 200-week moving averages, clustered between $2,400 and $2,700, providing a solid base for potential upside.
This market structure echoes the early stages of Ethereum’s past bull cycles. A clean break above $4,000 could spark a price discovery phase, with analysts eyeing new all-time highs later this year. However, $4,000 has historically been a tough barrier, rejecting price in early 2022 and late 2023. Without a significant retracement since June, a short-term consolidation or correction is possible, but the overall trend remains strongly bullish, with momentum firmly in Ethereum’s favor.
What do You Think Is Next for Ethereum?
With Ethereum ETF inflows hitting $2.18 billion in a single week, institutional adoption is clearly accelerating. The combination of regulatory clarity, strong fundamentals, and bullish market structure positions Ethereum for potential new highs. All eyes are on the $4,000 level – will bulls push through, or will resistance hold firm? Share your thoughts in the comments.


